Creating new layouts
RTE
2024-06-26
Source:vignettes/article/creating_new_layouts.Rmd
creating_new_layouts.RmdThe antaresViz package allows to visualize simulation
results. Several default layouts are available in the package, but, in
some cases, the user will need to create a custom layout.
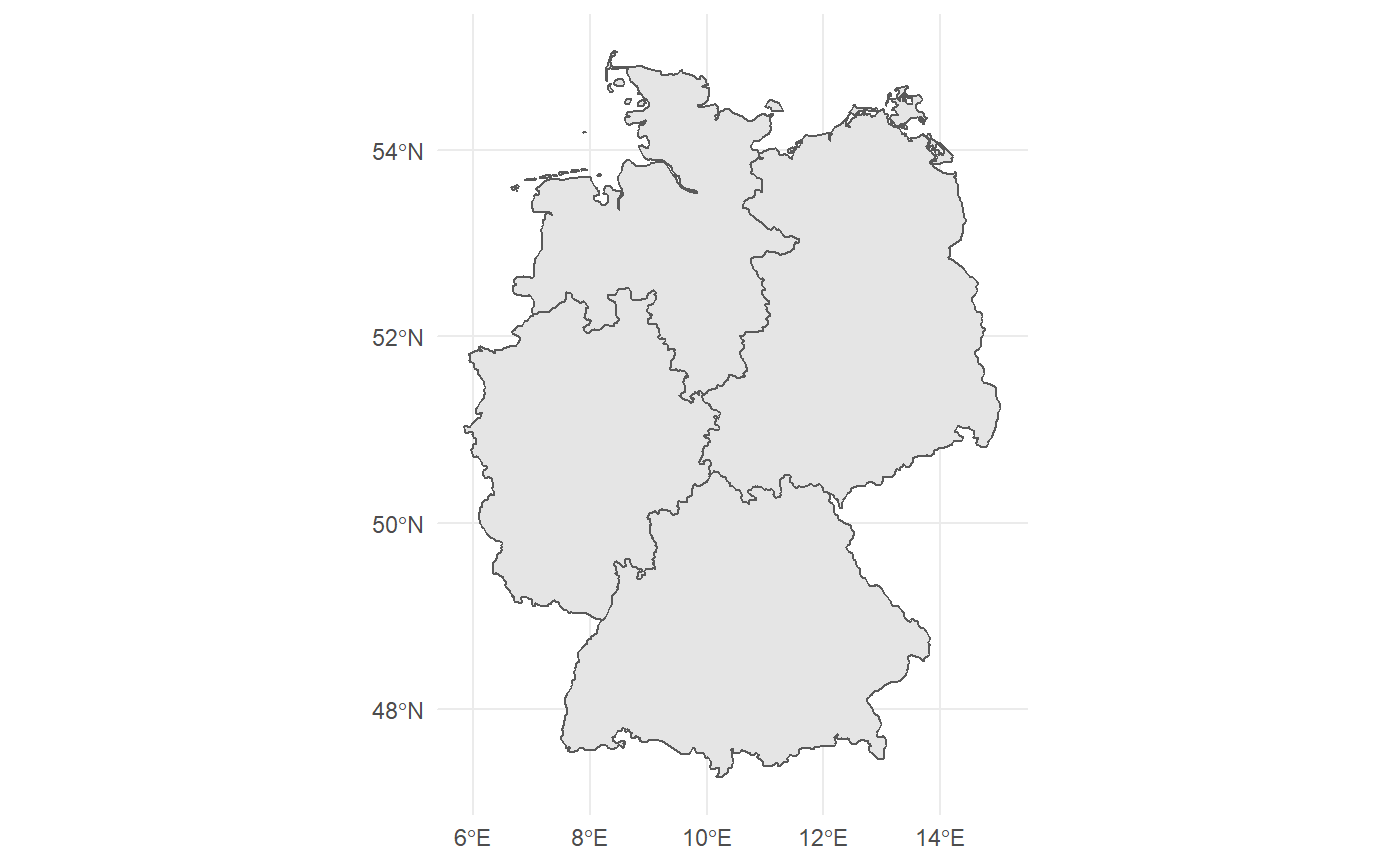
In this vignette we illustrate how to create a custom layout along the German inner borders.
The coordinates of administratives regions of most countries can be
found in the rnaturalearth package. Grouping these regions
together often allows to obtain the desired layout. For instance:
germany <- rnaturalearth::ne_states(
  geounit = "germany",
  returnclass = "sf"
)

german_zones <- germany %>%
  select(iso_3166_2, geometry) %>%
  transmute(zone = case_when(
    iso_3166_2 %in% c("DE-SL", "DE-RP", "DE-NW", "DE-HE") ~ "34_DE",
    iso_3166_2 %in% c("DE-BW", "DE-BY") ~ "35_DE",
    iso_3166_2 %in% c("DE-NI", "DE-HH", "DE-HB", "DE-SH") ~ "36_DE",
    TRUE ~ "37_DE"
  )) %>%
  group_by(zone) %>%
  summarise()

ggplot(german_zones) +
  geom_sf(aes()) +
  theme_minimal() +
  theme(
    legend.position = "none",
    axis.title.x = element_blank(),
    axis.title.y = element_blank()
  )
Then the layout map can be generated from
german_zones with a single line of code:
map <- as(st_transform(german_zones, crs = 4326), "Spatial")This map is then used to generate a
mapLayout object: